


Redesigned a Global Energy Intelligence Platform to Drive Clarity.
TGS is a global leader in energy data and insights, supporting decision-makers with information that powers exploration and sustainable energy development. TGS needed a digital platform that could distill vast datasets into intuitive, actionable dashboards for energy professionals.


The Challenge
Energy professionals rely on complex datasets spanning geology, sustainability, and production metrics. Yet these datasets are often siloed and difficult to interpret, limiting their usefulness for fast-paced decision-making. TGS wanted to create a platform that gave professionals clear visibility into critical data through intuitive dashboards.
The challenge was to design a system that could handle the scale and complexity of TGS’s data while remaining user-friendly. The platform needed to serve both technical experts and executives, requiring flexible views and visualization tools that balanced depth with clarity.

Our Approach
We worked with TGS to design and develop a dashboard system that brought clarity to energy data. Our discovery process mapped the needs of different user personas, from analysts needing granular insights to executives requiring high-level overviews.
Through Custom Web App Development, we built a scalable infrastructure capable of handling large datasets. We also designed visualization tools that allowed users to drill down into data without losing context, ensuring usability across levels of expertise.
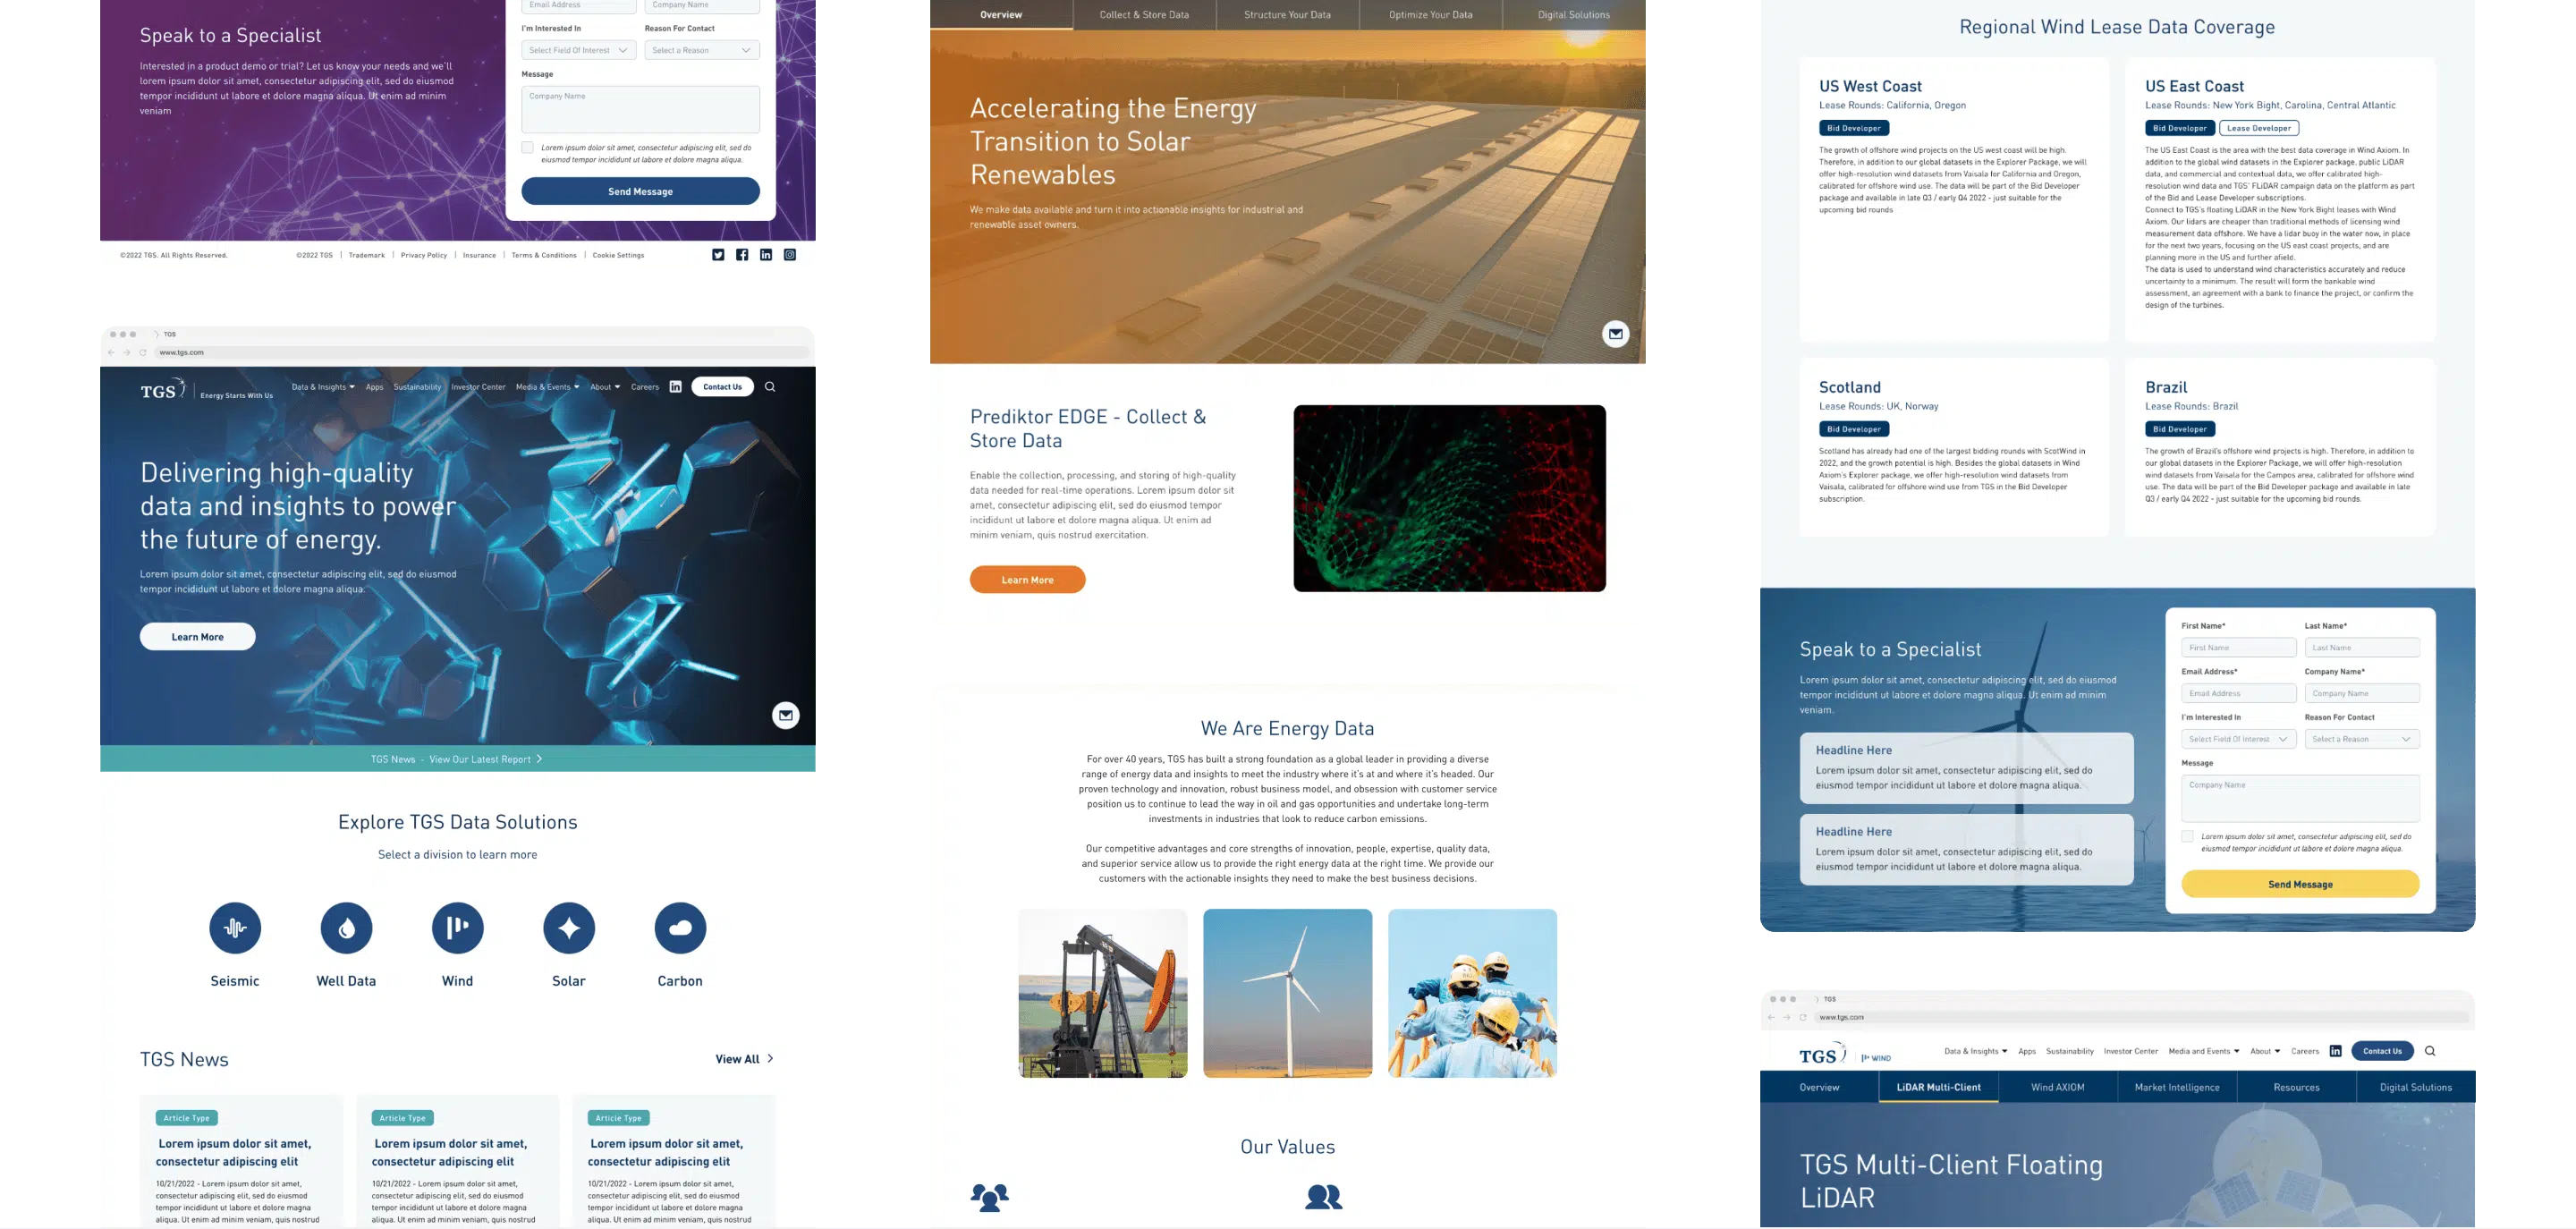
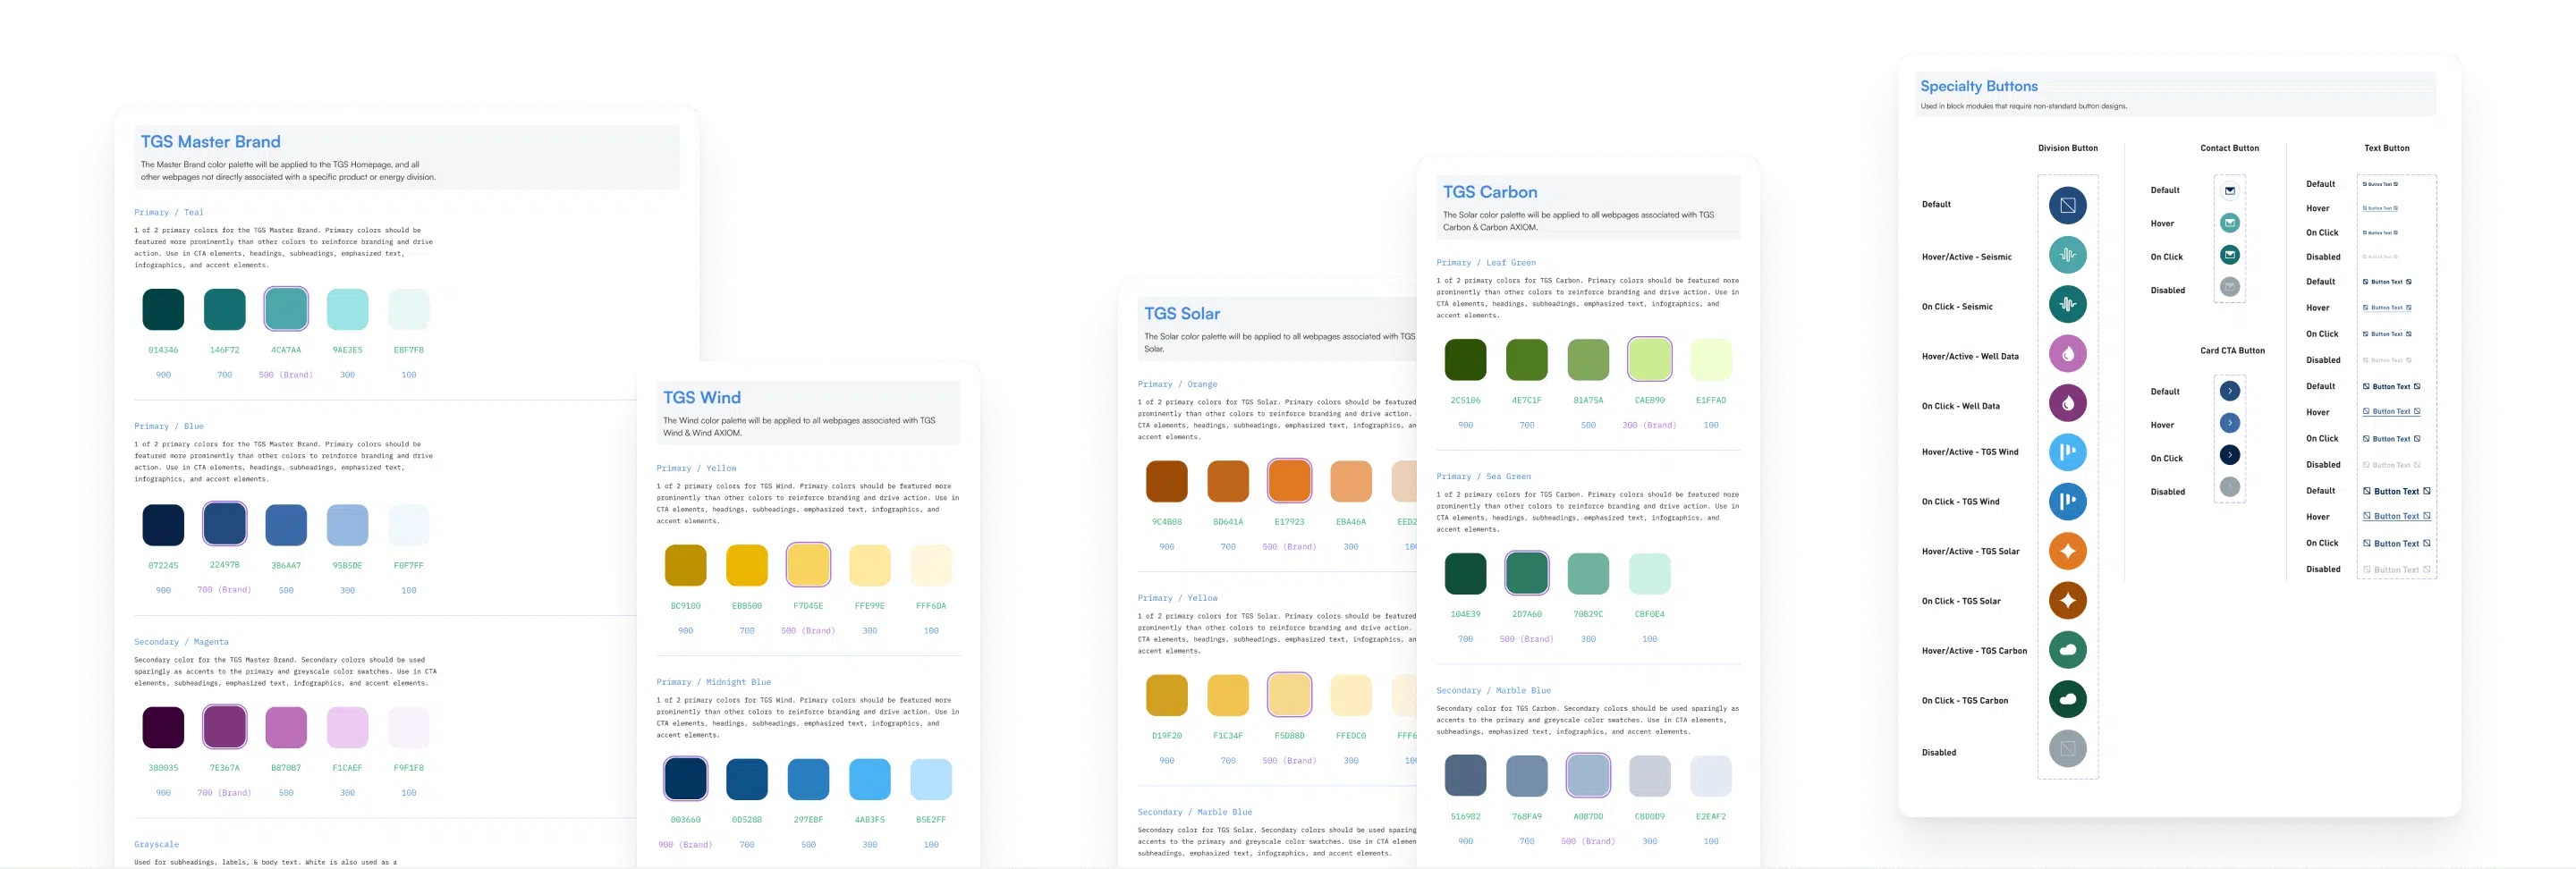
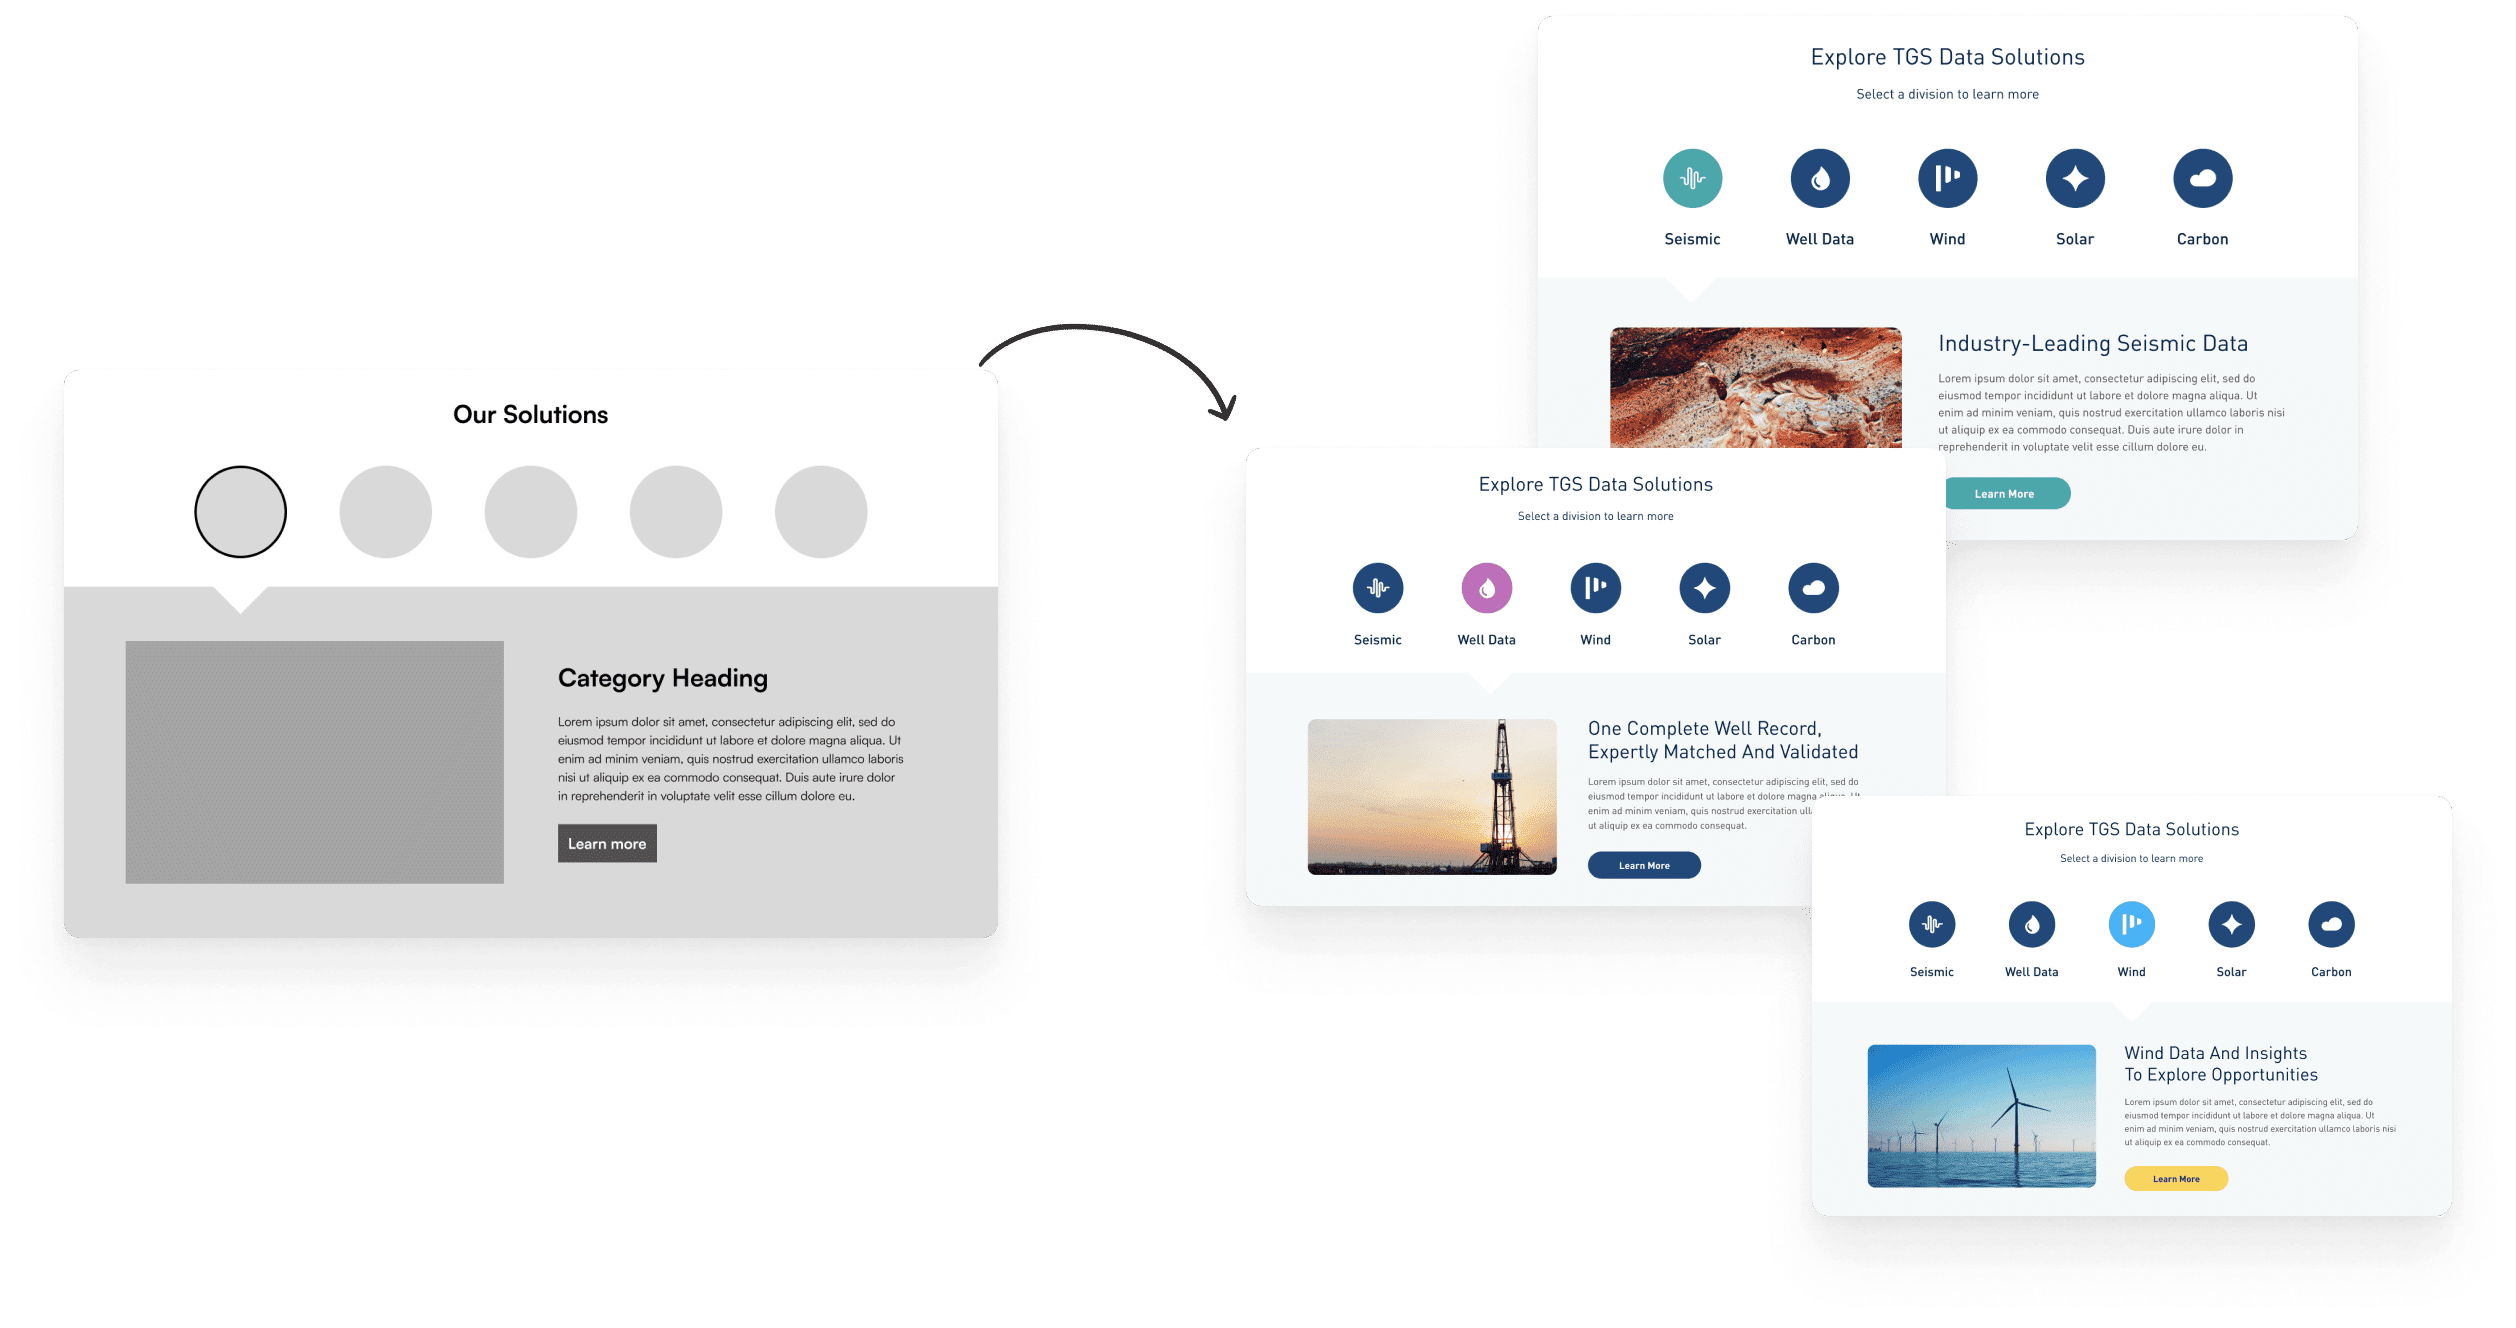
We led a full-site audit, conducted stakeholder interviews, and executed a modular UX strategy tailored for scale. With a modular design system we built flexible UI components reusable across the site’s five plus divisions. Using division-specific branding we implemented distinct color palettes and identifiers for seismic, well, wind, solar, and carbon data units. Our team built an Interactive homepage architecture and a selector tool to preview and access individual business lines and finally reduced jargon, introduced secondary nav, and clarified calls to action for each sector with a information hierarchy optimization.
- Conducted research into user personas across the energy sector
- Designed interactive data visualization dashboards
- Built scalable infrastructure to handle massive datasets
- Created UI/UX tailored to both technical and executive users
The Impact
The TGS dashboard launched as a transformative tool for energy professionals, improving decision-making and efficiency. Users reported greater confidence in their ability to interpret and apply insights, leading to measurable improvements in operations and strategy.
The platform strengthened TGS’s reputation as an innovation leader in energy data, helping clients embrace sustainable practices and competitive growth. They saw a 405% increase in page views for the seismic division with 6% overall increase in engagement site-wide. Their new division pages (Seismic, Well, Wind) are now in the top 10 most viewed pages, displacing legacy corporate content across the site. Their dev team also has faster implementation due to our modular and developer-ready design system.
- Improved user adoption across diverse professional audiences
- Increased speed and accuracy of decision-making
- Enhanced transparency and usability of complex data
- Positioned TGS as a digital-first leader in energy intelligence
Project Review

Natasha Wilson
TGS Digital Marketing Manager
“Since launch, I’ve seen engagement up 6%, page views up 25%, and total users up 5%. They were consistently on time, communicative, and easy to work with. I was genuinely impressed by their professionalism, expertise, and creative, forward-thinking design.”